Instagram Analytics is the foundation for a winning Instagram marketing strategy. Every strategic business decision should be based on data, and Instagram analytics is a goldmine of data that can help you drive phenomenal results.
Instagram is known for the high buying intent of its users. Nearly two-thirds of Instagrammers log in to their account daily to discover new brands and products and make purchases.
But, the problem is that an infinite number of business accounts are competing for the attention of these influential users.
So, how can you, as a brand owner, gain users’ attention on the app? You can use the data from Instagram Analytics and pivot your content marketing strategy.
This blog will show you:
- What are Instagram Analytics?
- The key metrics of Instagram Analytics,
- How to See Instagram Analytics?
Keep reading.
What are Instagram Analytics?
Instagram Analytics are tools that give access to data and key metrics of your Instagram account’s performance.
You can get data like how many users have viewed or liked a post, as well as the prime times when your audience is most active.
You can use this data and other statistics from the analytics to modify your Instagram marketing strategy based on how well you are hitting your goals.
Like any social platform, if you are not making marketing decisions based on user data, you are doing guesswork and praying that you might find success.
Note: Looking to grow on Instagram fast? Buy Instagram Likes Legit and save yourself a ton of time and resources.
The key metrics of Instagram Analytics
Here are the key metrics you should check in Instagram Analytics that matter the most.
Instagram Account Metrics
#1 Engagement Rate:
This metric is obtained by dividing the total number of engagements by the number of impressions on individual posts. This metric gives an idea of how well your content is performing. You can Get Instagram views to reach more accounts and hence increase your chances of getting more engagement and consequently enhanced engagement rates.
#2 Follower Growth Rate:
With an average monthly follower growth rate of 0.98%, this is one of the most important metrics to look out for. This number shows how fast your account is gaining or losing followers.
#3 Website Traffic:
Why not use Instagram to drive people to your blog or e-Commerce store? This metric shows how many visitors your Instagram account drives to your website. Leading brands use clickable links in their bios to send people off to their websites and generate conversions.
#4 Prime Times to Publish Content:
This is the metric that can make or break your Instagram marketing strategy. This metric tells you the specific times your audience is most active. This ensures maximum eyeballs to your posts as soon as they are posted.
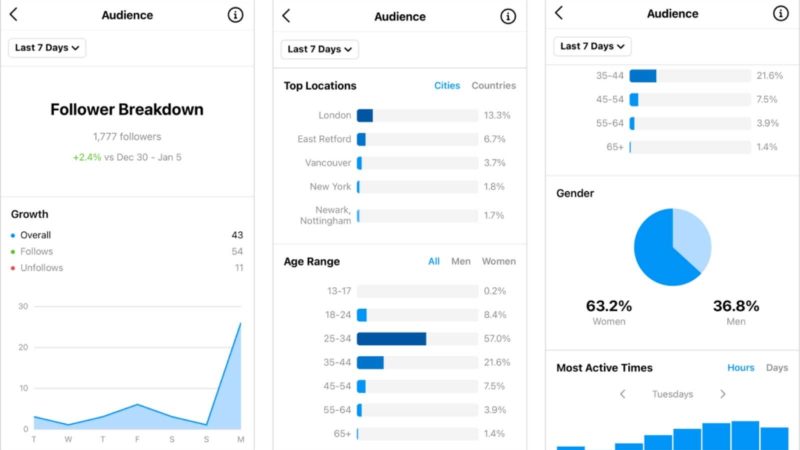
#5 Audience Demographics:
This is a combination of different data points that tells you who are your content consumers; gender, age, location, etc. While this data might seem insignificant, it’s not. It helps you focus on targeted content tailoring to a specific audience group to get maximum results.
Instagram Feed Post Metrics
#1 Post Engagement Rate:
The number of engagements as a percentage of the number of followers or the reach of a post. You can calculate it manually as well.
#2 Post Comment rate:
It refers to the number of comments as a percentage of reach or followers. To seek the attention of more users, you should strive to increase the number of instagram comments on your posts by any means.
#3 Impressions:
This refers to the number of times your posts are served to users as they scroll through their feeds. If your posts are getting an increasing number of impressions, that means your content marketing strategy is working.
#4 Reach:
This is the number of times users have seen your posts. If you create engaging content, the algorithm will show it to more users, and your reach will grow significantly.
Instagram Stories Metrics
#1 Story Engagement Rate:
Again, this equates to the number of engagements as a percentage of followers or reach – but for Stories.
#2 Completion Rate:
This metric tells you how many people have seen your complete Story or a significant portion of them. A great completion rate indicates that the audience feels relatability with your Stories.
Instagram Reels Metrics
#1 Reel Shares:
This metric shows how many people have shared your Reel videos on Instagram.
#2 Reel Interactions:
This includes the number of likes, comments, shares, and saves of your content.
#3 Drop-off Rate:
This shows how many people had stopped watching your reels before they ended. Ideally, you should have low drop-off rates to reach more user profiles and grow your audience.
#4 Views Vs. TikTok:
This tells how many users have seen your Reels compared to equivalent TikTox.
How to See Instagram Analytics?
On Mobile
You can get a basic overview of your Instagram Analytics on your smartphone if you want to have a look on the go. Here is how to see Instagram Analytics on mobile;
- Open Instagram, head over to your profile
- Tap “professional dashboard”
- Tap “See all” next to Account insights
- You can see an overview of your content (posts, reels, stories, etc.). Also, you will see the accounts reached, the number of engagements, the total number of followers, and the number of shares.
- You can choose a timeframe to view in the top menu
- Tap the right arrow against the relevant category to get detailed metrics

On Desktop
Accessing Instagram Analytics on your desktop allows you to regularly analyze your data, compare them, or generate a report. Here is how to see Analytics on desktop (you will need to switch to Meta’s business suite);
- Open Meta Business Suite and click on Insights. You will see Instagram insights on the left and Facebook insights on the right of the screen.
- In the left menu, you can click on a specific category to see more details.
- Click “Content” under the “Content heading” in the left menu. Then open the Ads, Posts, and Stories drop-down menu. Uncheck the Facebook options. This will give you only Instagram content metrics.
Final Words:
Instagram can be a great source for generating qualified leads and sales for a brand. Knowing the key metrics discussed in this blog will give you leverage to create content your target audience is interested in.