


Technical analysts look at different candlestick patterns to help them figure out the market. The candlestick patterns can be signaling different things, you need to know them to be able to read what it’s telling you. This article will teach you about a bearish pattern, the bear flag pattern, or the bearish flag pattern. You will learn what a bear flag pattern is, what it says and how you can trade it.
Candlestick patterns can signal the end of a trend, or that the current trend may continue. Or that the trend is resting for a while and getting ready for moving in the future.
Some candlestick patterns are bullish, and some c andlestick patterns are bearish. The bullish patterns signal that the bullish trend can continue or a bullish trend is about to start. The bearish trend on the other hand signals that a bearish trend may begin, or the current bearish trend is likely to continue.
Bear flag pattern
The bear flag pattern or the bearish flag pattern is a candlestick pattern that signals to the traders the current bearish trend continues after a short break. The short break will happen when the price consolidates inside a channel. We will talk about the consolidation phase in more detail later in this article.
The only true difference between the bearish flag pattern and the bullish flag pattern is that the bearish flag pattern appears in a bearish trend and signals the continuation of the bearish trend. But the bullish flag pattern appears in a bullish trend and signals the continuation of the current bullish pattern. Like its counterpart, the bear flag pattern consists of a flag, and a flagpole. The flag is where the consolidation phase happens, the flagpole is where the downtrend is.
How to identify the bear flag pattern?
This section of the article will teach you how to identify the bear flag pattern or the bearish flag pattern. By identifying the bear flag pattern you will be able to enter a short position on an asset to make profits. Or to get ready for the price to drop after the consolidation phase, so you’re able to buy or enter a long position on an asset for more profits.
After understanding how each component of the bear flag pattern is made, identifying it is easy. Once you understand the bearish flag pattern you can easily tell when you’re looking at a bearish flag pattern.
The bear flag pattern appears in a downtrend. So, in a downtrend, after the price action of a certain asset is creating lower lows and lower highs, the price enters a consolidation phase.

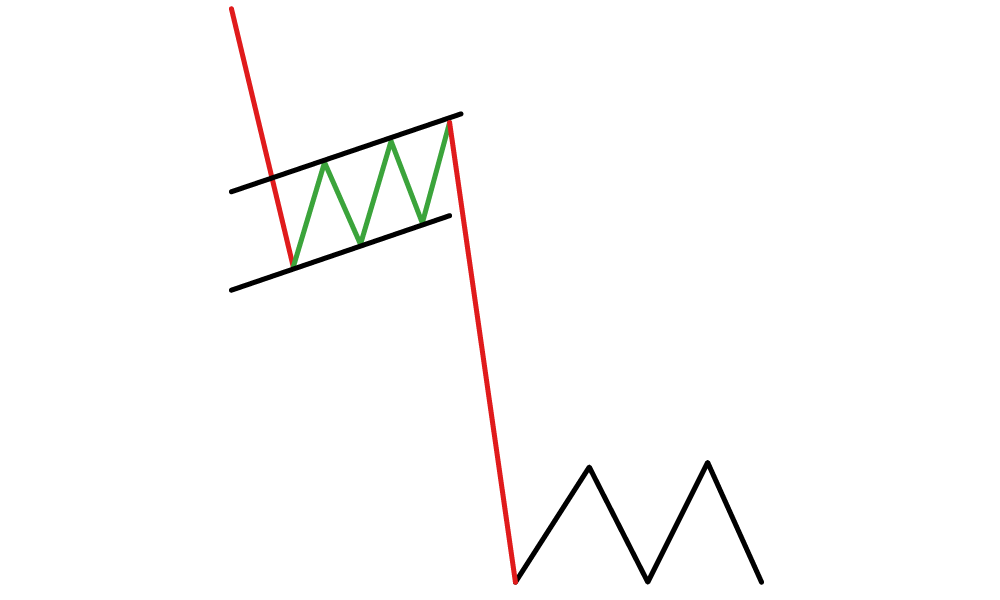
The green lines moving between two parallel lines (parallel channels) are called the consolidation phase.
Three components of the bear flag pattern:
Before the consolidation phase, the sellers are in total control. This causes the price action to drop, making new lower lows in each little swing.
During the consolidation phase, the bears take a break for a small amount of time. During this time the bulls (buyers) try to take back control of the trend. Beats use this time to consolidate their profits while bulls increase the price a little. During the consolidation phase, the price action might experience a rebound. While the rebound happens the price action climbs up and claims some of the previously lost levels.
You might be thinking, how much rebound is, well rebound? And how much rebound means the bear flag pattern isn’t going to happen? The answer is somehow simple. The rebound shouldn’t exceed the 50% Fibonacci retracement level of the flagpole. Though the fact that the rebound is milder or sharper completely depends on how strong the downtrend in the flagpole is. And the shorter and weaker the rebound (consolidation phase) is, the stronger the downtrend after the breakout is.
The final component of a bear flag pattern is the breakout. The breakout happens after the consolidation phase is over. The breakout is your signal to enter the position. Although you must not forget that a fake out is also a possibility. You shouldn’t enter a position without enough confirmation and evidence.
Q&A
Is the bear flag bullish?
No. The bear flag consists of a flagpole and a flag. The flag is a consolidation phase in a parallel channel that is upwards and actually visits some of the lost levels once again.
How reliable are bear flags?
The bear flag pattern and the bullish flag pattern are the most reliable candlestick chart patterns. However candlestick patterns are only reliable if identified correctly, so make sure to get confirmation.
What do you do with a bear flag?
During the flagpole, you can expect a consolidation phase. And during the flag, you can identify the bear flag pattern and wait for a breakout. After the breakout, you can trade the bear flag pattern.