VWAP is another stock indicator. Although, VWAP is not as well known as the Moving Average or MACD. Nevertheless, you probably have heard of VWAP before.
In this article, we will give you an in-depth introduction about VWAP indicator. VWAP stock indicator is another tool that traders use to analyze the market. Read this article to learn what the VWAP means and if VWAP is a good indicator.
Investors and traders have been using indicators for a long time. Although, there are trading strategies that don’t need an indicator. But no one can say that indicators are useless nowadays. Investors and traders use indicators to find the best price to buy and to sell their stocks.
You can also learn about the VWAP stock indicator to take your trading to the next level. Then, you can understand the market price trends better. Therefore, you will become a better trader even if you don’t use VWAP stock indicator.
What is it?
The VWAP indicator is an indicator that gives information about an asset’s price and volume. Therefore, it can provide you with a lot of useful information. You will know about the average of that asset’s price as well as its volume just by looking at it. Then, you would know the best price to invest in the asset.
This indicator shows the average but is based on the asset volume as well. Therefore, the VWAP indicator is a representation of the asset’s price and its volume. Then, the VWAP stock indicator offers a reliable moving average. Now, let’s find out what the VWAP meaning is.
What is the VWAP meaning?
In this section, we will discuss the VWAP meaning. To be precise there is nothing much into the VWAP meaning. VWAP is short for Volume Weighted Average Price (VWAP). Therefore, the VWAP meaning is just an acronym.
Then, don’t get hung up on the VWAP meaning. Instead, read the rest of the sections to learn how to trade using it. Then, let’s not waste our time and begin.
How do you read VWAP?
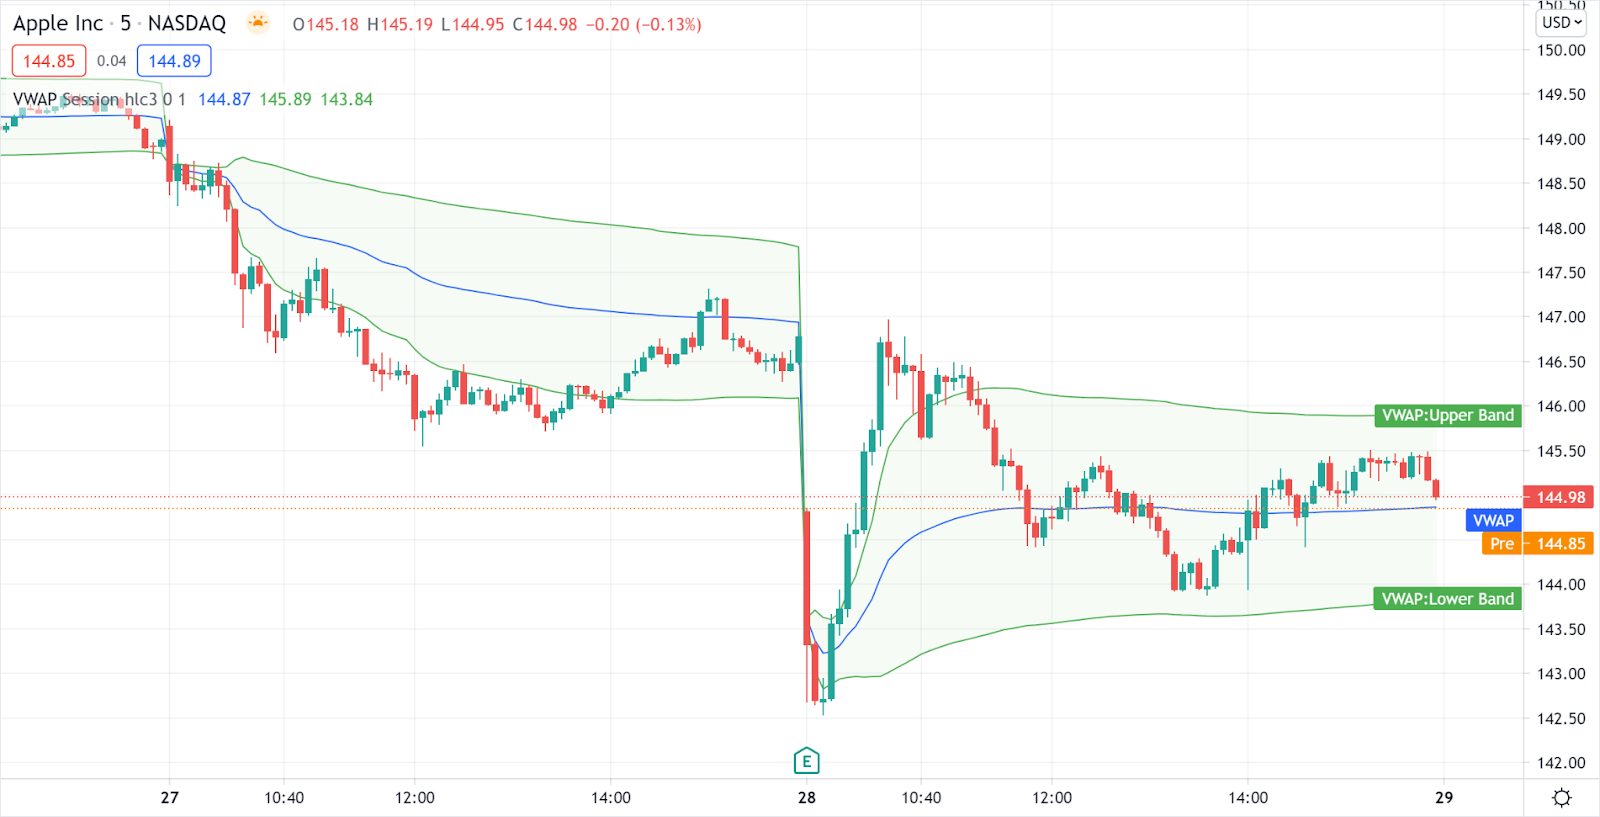
Now that you know the VWAP meaning, we can move on. In this section, we will tell you how to read the VWAP indicator. The VWAP indicator consists of three lines. Investors and traders use the lines to decide when to buy and sell an asset’s stock. An asset that is above VWAP stock indicator is overvalued. And a stock that is under the VWAP indicator is considered undervalued.
What are the 3 VWAP lines?
As you know, the VWAP is made by three different lines. In this section, we will introduce each line to you. The middle line is the VWAP plot. The other two are the Upper band plot and the Lower band plot.
When a price breaks the Lower band plot towards up, that’s a buying signal. This shows that the asset was previously undervalued. But now the investors are buying it. Therefore, the price will increase when it is getting the attention it needs.
At the same time, the opposite is also true. When the price breaks down the upper band plot and continues moving down, it’s a bearish sign.
Is VWAP high good?
This depends on some factors. For example, if a stock is starting to reach the VWAP indicator high, it is a good signal. But if a stock has been over the VWAP high for some time, it tells a different story.
This means that that asset has been overbought for some days. Or to put it differently, investors have been buying this stock a lot more than they used to. Therefore, they can start selling anytime. Then, you shouldn’t just buy any asset that is over the VWAP.
Why is VWAP a good indicator?
To put it simply, yes. Now, let me elaborate. The VWAP stock indicator moves based on the stock price as well as the stock medium. Therefore, you will have a more clear and more realistic take than a standard moving average.
The VWAP stock indicator takes the asset’s volume into account. This is important because an asset’s volume shows the traders or investors interest in that price. For example, if bitcoin drops to $10,000 and a lot of investors buy it so much that the volume grows abnormally bigger, you would know that this is an important level.
Therefore, you can use the volume to gain information about the asset’s price. Then, you would be able to perform much better. Either if you work as a trader or investor. That is why the VWAP indicator is a good indicator.
Is VWAP bullish or bearish?
No one can say that the VWAP indicator is bullish or bearish. Because this indicator signals both a bullish trend and a bearish trend. Then, you should read the signal in its context.
This means that you should also check the asset’s price on previous days. Therefore, you can’t tell if the VWAP stock indicator is bullish or bearish. You can use the VWAP indicator to get both buying and selling signals.
FAQ
Which technical indicator is the most accurate?
Technical indicators all give false signals from time to time. This is because they can’t have an understanding of the price from all aspects. Therefore, you should be careful to not trade only according to indicators. But some indicators are more accurate. The most accurate indicator is probably MACD or the Moving Average Convergence/Divergence line.
Does VWAP reset every day?
Yes. the VWAP indicator resets every day. It resets every day if you are using a one-day candlestick chart. This depends on the time slot that you are using. If you want to look at the VWAP stock indicator in other time slots you should reset its setting.